Trends in Driver Sentiment
Is Uber driver satisfaction as bad as it appears in the news? It seems that drivers are continually becoming less satisfied, but does the data support this? A sentiment analysis was performed on each review using the syuzhet package in R. Using this data as well as the time stamp of the review, the following provides a visual representation of the sentiment amongst Uber drivers over time. The vertical line around August 2017 represents the takeover of the new CEO.
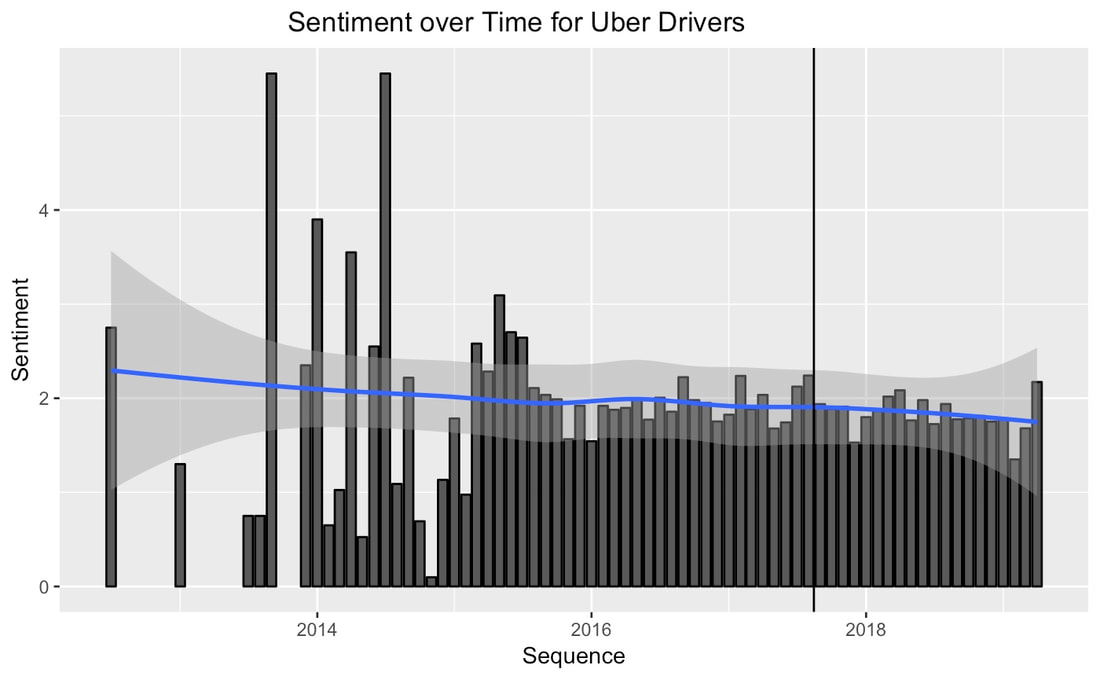
Just by eyeballing the chart, it is evident that the sentiment amongst drivers has been on a downward trend since Uber's inception. Even after the introductions of the new CEO, there doesn't seem to have been any improvement in driver satisfaction. This continuing downward trend could cause trouble for Uber and should really be addressed as quickly as possible; it does not seem like the new executive management is doing anything to improve this.
|
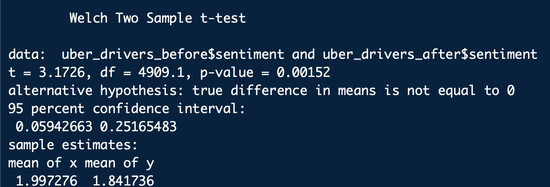
This t-test tests whether there is a significant difference in driver sentiment under the old and new CEOs. The t-test finds that the sentiment amongst drivers is actually significantly more positive under the old CEO compared to under the new CEO. This might mean that things have gotten worse for drivers, or perhaps old practices still linger, but either way, it is very unlikely that there has not been a positive improvement.
|
|
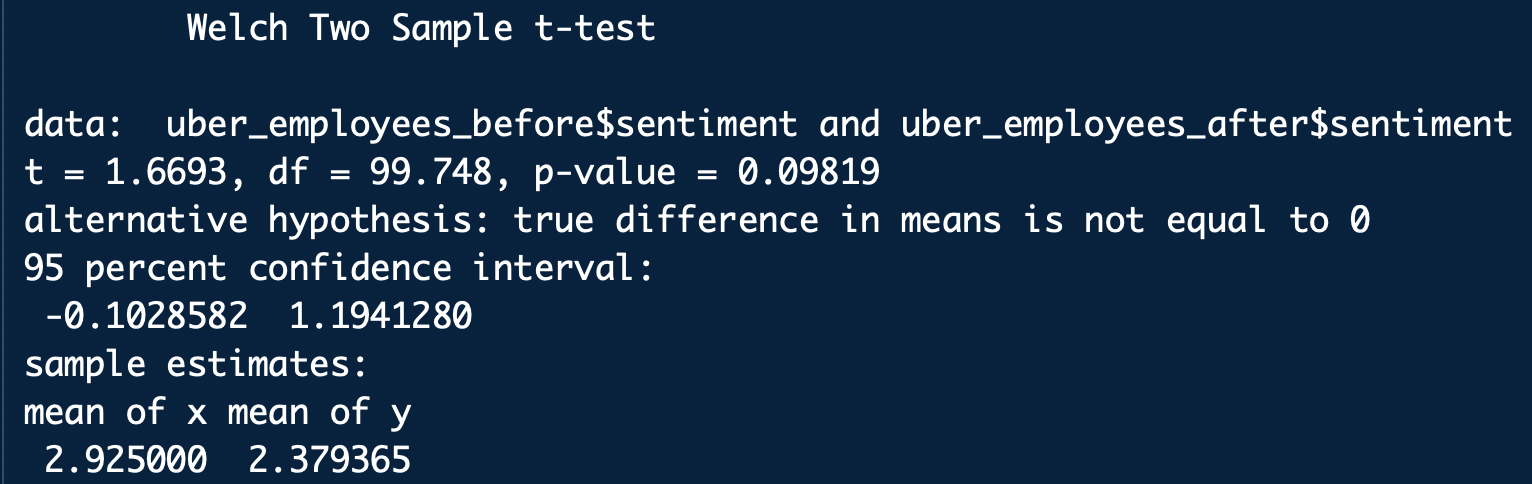
Uber Employees Average Monthly Sentiment

Is declining sentiment unique to its drivers or is declining satisfaction rampant throughout the firm? The following is a representation of Uber employee (excludes drivers) sentiment over time. Again, the vertical line represents the changeover in CEO.
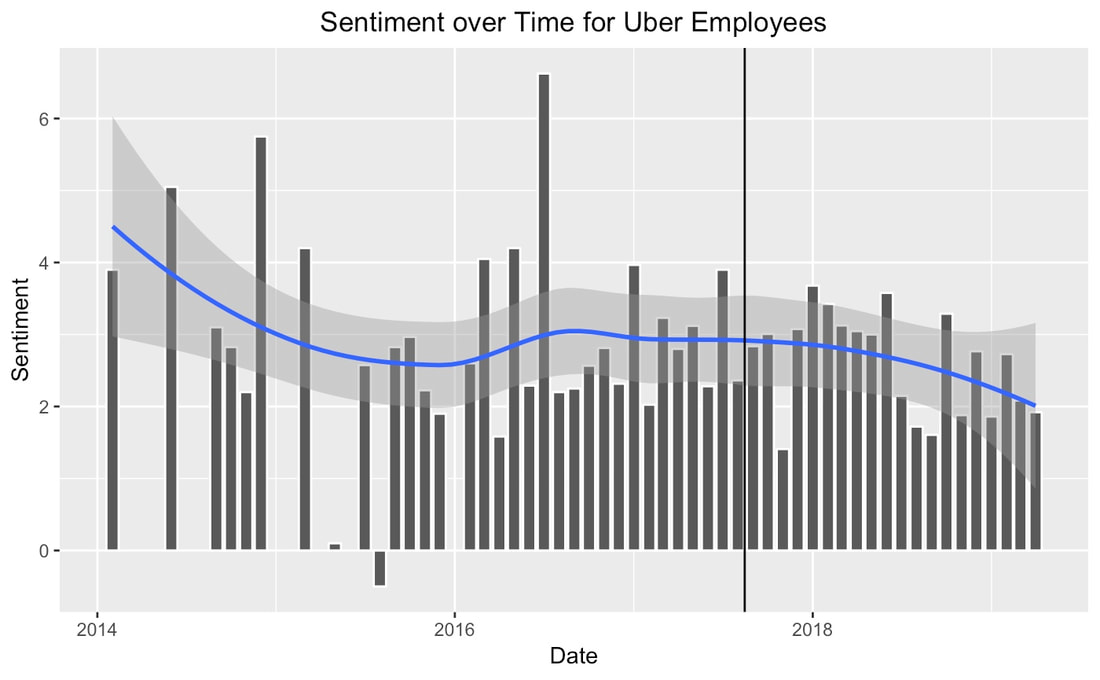
Just eyeballing the chart, employee sentiment at Uber also seems to be on a decline. This is interesting given that neither driver or employee sentiment seems to be improving.
|
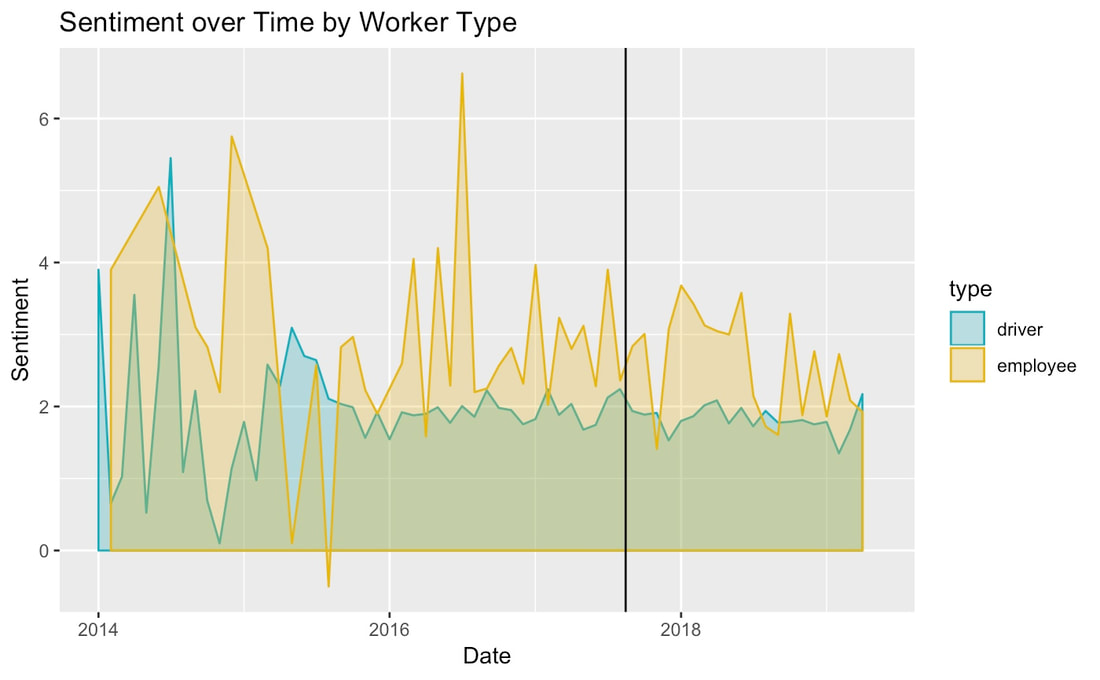
Although the graphic shows there to be a declining trend, the t-test finds that there is not a significant difference in sentiment before and after the CEO changeover, although the sentiment before is definitely higher. More complete data is likely needed here.
|
|
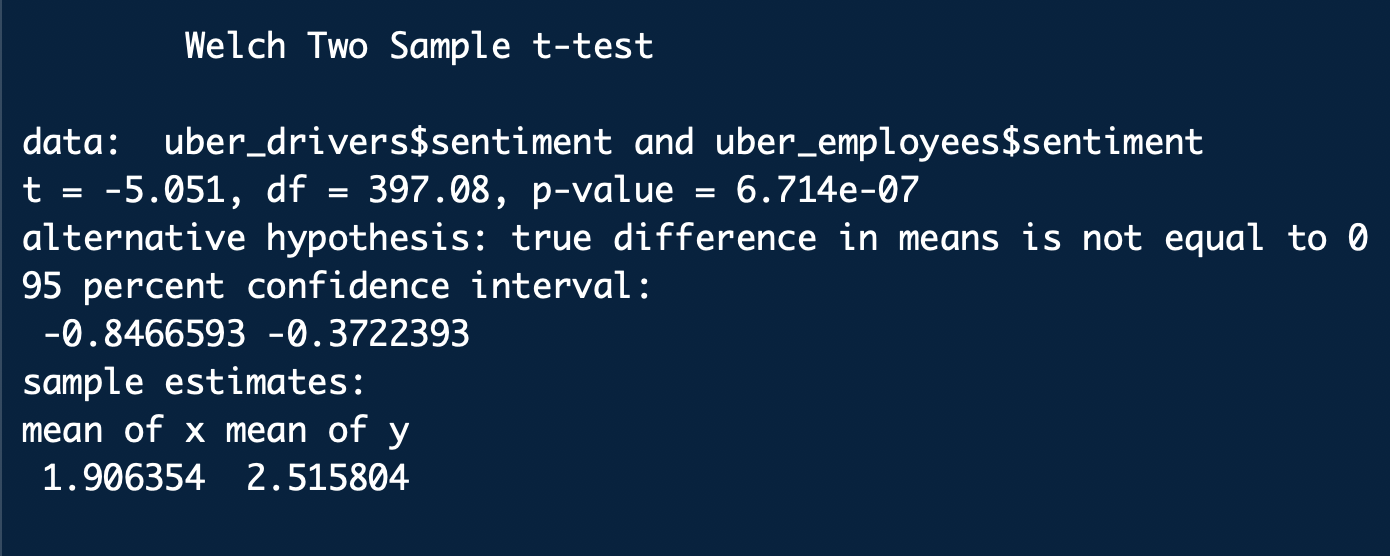
Sentiment Between Drivers and Employees Over Time
|
Employees seem to be happier than the drivers for the most part as would likely be expected. This finding is highly significant as seen with such a small p-value.
|
|
